|
|
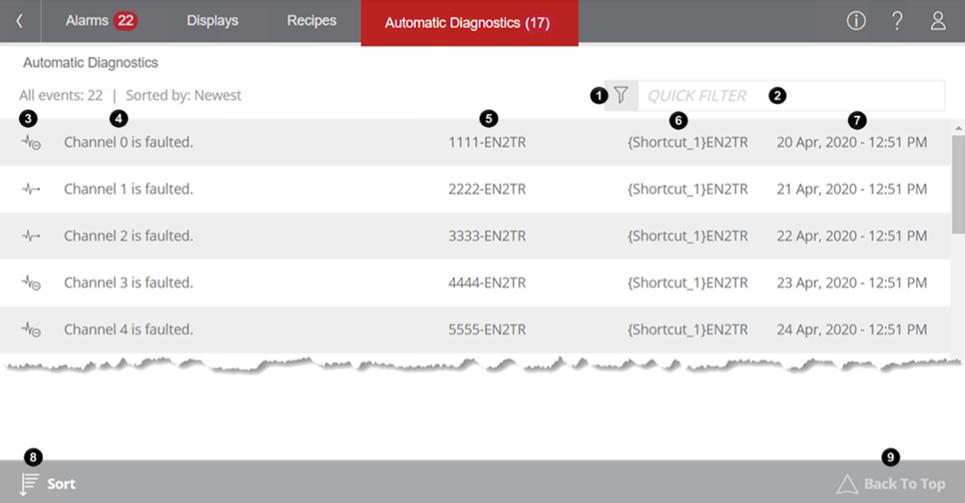
Automatic Diagnostics page
How do I open the Automatic Diagnostics page?
- From the mobile menu or title bar, select Automatic Diagnostics.
The Automatic Diagnostics page in a web application subscribes to and displays diagnostic events collected by Rockwell Automation controllers via Ethernet. It is enabled by the Automatic Diagnostics feature. When accessing a web application using the mobile URL, you can use the Automatic Diagnostics page to suppress, unsuppress, filter, and sort diagnostic events.
|
Item |
Description |
|
|
This is the Filter icon. Press this icon to open the Filter Events dialog box and to limit the events shown on the Diagnostics Events page by their states, including:
|
|
|
This is the Quick Filter box. In this box, type the text to show the diagnostic events that match the text. Diagnostic events are filtered as you type. You can also quickly filter events by entering text in the URL in the following formats and bookmark the URL for easy access: http://computer_name_or_ip_address/FTVP/m/#/diagnostics?filter=text |
|
|
This column shows the changes in states caused by events:
|
|
|
This column shows the messages of diagnostic events. |
|
|
This column shows the catalogs of the devices that issued events. |
|
|
This column shows the names of the devices that issued events. This column only shows on large screens. |
|
|
This column shows the time when the event conditions changed to the currently shown states. |
|
|
Press this icon to change the order in which events are shown. |
|
|
This is the Back to Top icon. When you scroll down on the page and a new diagnostic event happens, a red bullet shows on the right top of the icon |